5 Ways to Monitor Disk Activity on Windows
When Windows is sitting idle and you think it’s doing nothing, it is often reading from or writing to your hard drive, even if it’s only a few bytes here and there. Sometimes there may be constant drive activity when you think there really should be very little, or none at all. This could be due to a number of factors such as security software updating or running background scans, scheduled defrags, Windows updates being installed, web browsers or download managers, the list goes on.
Checking what processes are constantly and actively accessing your hard drive is important to detect suspicious or unnecessary activity. Solid State Drives (SSDs) only have a limited number of writes so it is especially important that those devices don’t have programs constantly writing to them when they don’t have to. Also if you’re using a laptop, a constantly working hard drive will help shorten the battery life.
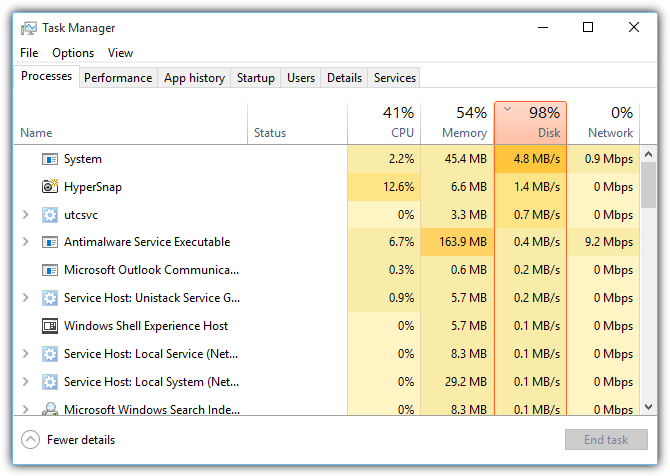
One of the improvements in Windows 8 was the updated built in Task Manager that includes a column for each process’s disk usage. This is something not included with the Windows XP, Vista or 7 Task Manager. While it’s not particularly advanced, the Windows 8 and 10 Task Manager disk usage column does at least give you a good idea if something is using the hard disk more than it should.
If your version of Task Manager doesn’t have disk usage activity monitoring or you want to separate reads and writes, which the Windows 8 and 10 version cannot do, here are 5 alternative ways to find out what programs are accessing your hard disk drive.
1. What’s My Computer Doing?If you want a simple interface that shows what is currently accessing your hard disks with nothing at all to configure, then What’s my computer doing? will probably be the tool for you. Besides hard disk access, the program will also show what is using up CPU cycles, give information about the process itself and even offers the option of sending the file to VirusTotal or running a scan with Kaspersky Security Scan.
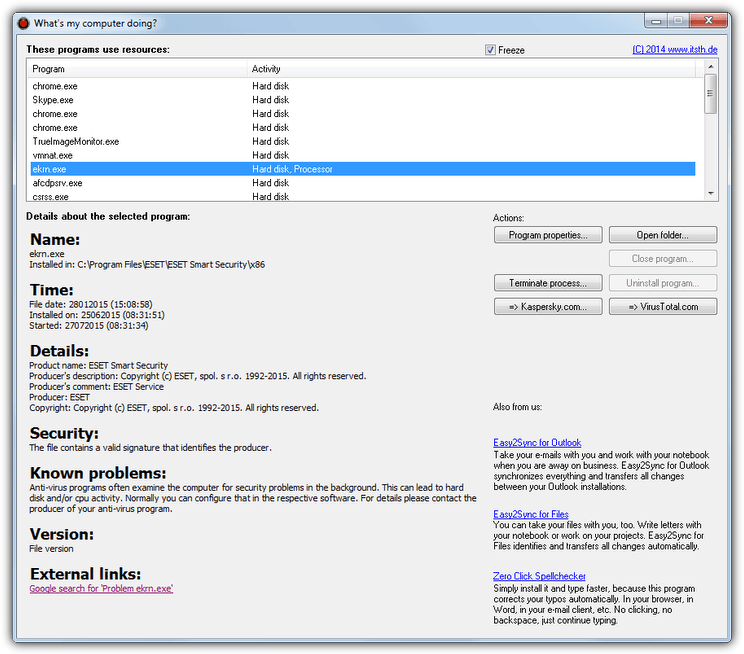
The program’s interface is very easy to understand. After installation (or extract the executable with 7-Zip to get a portable version), run the program and it will automatically start monitoring your system and display the processes that currently have hard disk or CPU activity. Use the Freeze tick box to pause the list if the window is updating too quickly for you.
Clicking on the process in the list will pull information about the process from the internet such as details, security, known problems, external links and etc. If you don’t allow the program to access the internet or have no internet on the computer, none of the details at all will be shown.
Download What’s My Computer Doing?
2. Real-time System Monitoring
System monitoring will give you information about disk usage and file system activity in addition to many other things, and probably the number one tool for this job is Process Monitor by Microsoft owned Sysinternals. For such an advanced tool Process Monitor is reasonably easy to use and it starts monitoring the system as soon as you start the program. The filtering system is probably one of the most important areas to get to know otherwise you will always be overloaded with information.
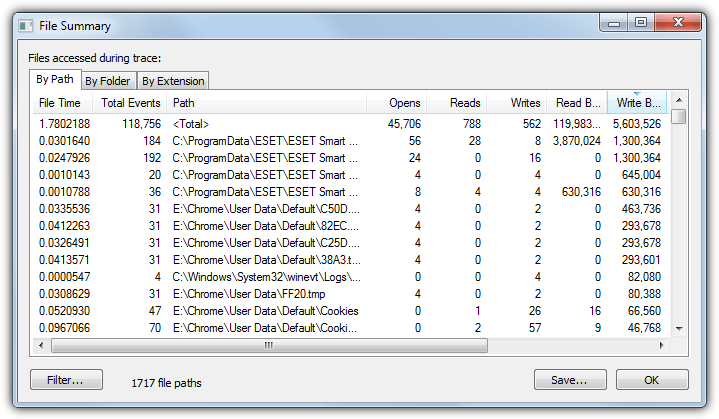
One issue is the window that displays the disk activity isn’t in real time and shows what has been happening right up until you open the File Summary window. To open the window, launch Process Monitor and let it monitor the system, preferably when you get unknown or abnormal disk access, then go to the Tools menu > File Summary. This window will show information about reads, writes, events, file access times and the path to the files causing the activity.
The By Folder tab is useful for tracing if file reads or writes are coming from non standard locations such as the Temp or Users folders or even other drives. The Extension tab can sort everything by the file that has accessed the drive’s extension, useful for checking unrecognized files with extensions like VBS, BAT, COM or EXE.
A similar tool by SysInternals called DiskMon is also available although it dates back to 2006. It can log and display all hard disk activity on a Windows system but only tells you which sector is being read or written and not the process that is causing the activity. This makes it difficult to tell which file or program is accessing your hard drive using DiskMon by itself.
3. Using a Task Management Tool
As you might expect, a good task manager is able to display which open process is accessing the hard drive and by how much in addition to CPU and memory usage etc. There are many such tools around that can do this, including Process Explorer, Process Hacker, System Explorer, and others. The tool we’ll look at here is Anvir Task Manager Free simply because it has a real time Disk Load column displayed by default.
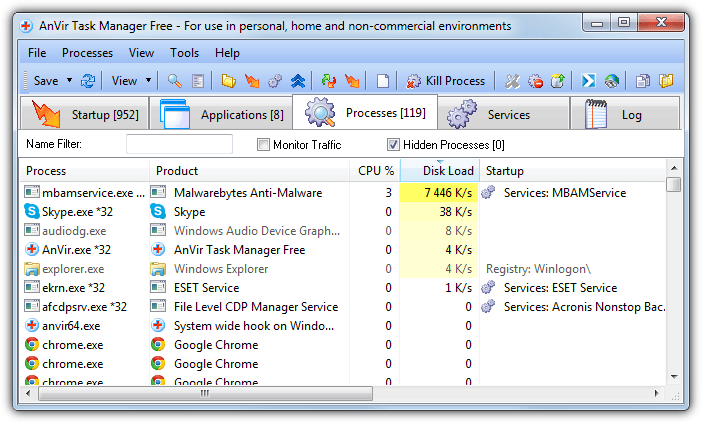
While installing Anvir free be careful to avoid the adware during install, or preferably use the portable version. Run the Anvir.exe and once started select the Processes tab. The read and write load on the disk in Kilobytes per second is already shown in its own column and displayed with a yellow background which becomes brighter the higher the activity. Click on the column header to sort by the most or least active. Obviously being a task manager you have the options to manipulate and get more information on the running processes causing high disk usage.
Download AnVir Task Manager Free
If you want extra detail like separate reads and writes from something like Process Explorer, you need to manually add the columns to the display. Right click on the column titles > Select Columns, from the Process I/O or Process Disk tabs select “Delta Read Bytes” and “Delta Write Bytes”.
4. Windows Resource Monitor
Something many users tend to overlook is Windows often has what you need right there built into the operating system, sadly most of the tools are hidden away or are not well documented and therefore remain relatively unknown. Thankfully Resource Monitor is easy to get to, simply open Windows Task Manager, click the Performance tab and then the Resource Monitor button at the bottom. Alternatively type Resmon into Start or the Run box.
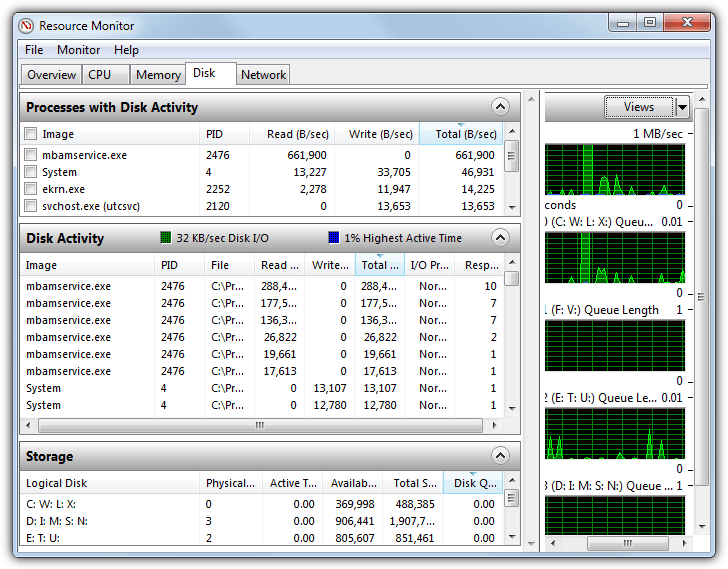
Windows Resource Monitor is actually quite comprehensive and besides displaying disk activity, it also shows information for CPU, network and system memory activity, all of which can be shown at the same time or separately for more detail. To concentrate on the activity of the system drives only, select the Disk tab. This will give you a display with “Processes with disk activity”, “Disk Activity” and “Storage” sections, each of which can be opened or closed by clicking on its header.
You can easily sort the lists by the amount of disk activity by clicking the column title such as (Total B/sec) which will show in real time which system processes are using the disk drive the most in bytes per second. Ticking one of the boxes next to a process at the top will populate the Disk Activity area with just the activity for that process, multiples can be ticked if you wish. Graphs on the right will show how much your drives are being used in real time.
5. View Process Disk Activity From the System Tray
A less intrusive way to keep an eye on programs accessing your drives while not having opened windows obscuring your desktop, is to show the activity from the system tray. This way you can hover over the tray icon only when required to see what’s going on. The good news is some process managers like Process Hacker, Anvir Free and Process Explorer can show this activity in the tray, but we’ll look at Process Hacker because its display is superior to the others.
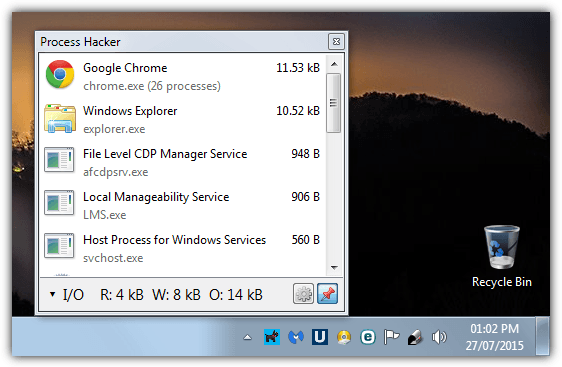
Install Process Hacker or run the portable version and launch the program. Go to the View menu making sure the Refresh Automatically option is ticked and then select Disk History, I/O History or both from the Tray Icons sub menu in View. If you select just one option it can be switched between different histories from the tray, more than one selection here will open more than one tray icon at once. Minimize the Process Hacker window and then hover over its tray icon to see the process disk activity list popup.
If you wish to keep the window open while doing other things, click the pin button. switching between I/O and Disk or any other history is done by clicking the stats bar across the bottom. The list auto updates every second by default (it can be changed from 0.5s to 10s) with the most disk intensive processes listed from the top down.
To monitor Usage Page Space and send to slack channel an alert:
#!/bin/ksh
mon=”$(svmon -G -O unit=MB | head -5|tail -1| awk {‘print $4’})”
monf=”$(svmon -G -O unit=MB | head -5|tail -1| awk {‘print $4’} > /home/root/svmon.log)”
if [ ${mon} -gt 1900 ] ; then
mail -s “pgsp” [email protected] < /home/root/svmon.log;
fi
You can find here github.com/imvieira/SysAdmin_DevOps_Scripts/blob/master/monitor_page_space_used_send_slackchannel_msg.sh
I was looking for something to tell me what process was accessing my network drives, not the local hard drive. So my issue was a little different than what is discussed here, but it turned out that Process Monitor worked great for this. I was able to set up a filter that only showed accesses to the network drives and I very quickly found out exactly what I was looking for. I was able to remove the program that was touching the drives every 20 seconds or so and preventing the drives from going to sleep. Thanks for this very informative article!
Problem is most of those programs actually log their activities causing unnecessary writes to the disk as well. I finally switched OS and rarely see a disk access. But for those who are less adventurous. One way to solve some of the access problems is to disable logging and auditing unless your system has crashed recently. And set your defrag and updates to something like once a week or once a month and turn off all the process and performance tracing utilities unless you are debugging or developing. I haven’t seen a hard disk access since before I started writing this post.
I actually thought that the hard drive indicator light was there to tell me that the drive was ready. Heck my new OS accesses it so infrequently (due to effective memory usage and proper pre-cacheing) that if I didn’t know better I’d think something was wrong with the hard drive or something. Anyway I didn’t come here to plug Ubuntu or Linux. Partially because it is not quite as user friendly as windows eg. many tasks require using a terminal or entering your admin password. But I figure I’ll never use up my 600k hours that this hard drive is rated for now that I no longer do unnecessary disk access all the time.
Nevertheless the tools you mentioned are great for finding out which programs are doing all of the reading and writing. Just remember to turn them off when you’re done or they will by default cause their own overhead in disk accesses. The most annoying one is finding out that system or syshost or spp. ldap etc are doing all the writes. Because that means that you have enabled some sort of background task that has lots of dependencies and keeps lots of unnecessary files open.
Setting logging to crash dumps and system errors only and either turning indexing off or setting it to only index media and documents will definitely help and the tools you have listed are pretty awesome for getting right to the core issues. But for me being a developer and having my computer crash and constantly in debug mode Windows just ran non-stop trying to see if I was breeching their EULA and constantly wanting internet access or to log everything to send to Microsoft every time I got online my disk was constantly whirring.
Just my $0.02. Hope it was supplemental to your excellent article.
Cheers
Sweet little tool. I love seeing the file activity. No more mysterious HD thrashing by covert corporate and Microsoft updateware. Thanks a million!
Thanks raymond this was helpful for me to find a virus in my system
thanks
Thanks Raymond! This is very useful for me.
Great tips.
I would like to know why XP needs like 40 things running in the background, drives me crazy.
Hi, Raymond, thanks for your tips.
Im 1 off your blog reader.. :)
And im now converting this message in our own language, and send to my group :)
Thank you brother !.
thanks for this tool.:)