PC Voltage Monitor Software [CPU, Motherboard]
As we all know, anything that runs on electricity generates an amount of heat to some degree, whether it’s your television, mobile phone or desktop PC. And in the case of a modern computer, several parts inside can get incredibly hot, even up to the boiling point of water! Generally speaking, the hotter an electrical component operates, the shorter its lifespan could potentially be because of the extra stress it has to endure.
Computers have always had devices inside them such as heat sinks and fans to try and cool the hardware components down as much as possible and stop any problems related to excessive heat occurring. Sometimes though the processor, graphics card, power supply or even a hard drive might be getting hotter than needed because of inefficient cooling, dust build up or simply a faulty fan somewhere. The CPU could run into problems such as shutting down the system unexpectedly if it gets too hot.
Are you worried your computer might be running a little hotter than it should be, an overclocker trying to push the system to its limit, or just somebody who is curious to know how hot a certain hardware component is getting or if the cooling fans are running properly?
Most components inside a modern PC include some form of monitoring sensors that can tell you things like temperatures, power draw, fan speeds etc. One of the ways to find these values on most systems is in the BIOS. But obviously you’re not going to sit in there all day just to look at those values! An easier way is to use a Windows utility to get the information for you and then you can monitor things from the relative comfort of your desktop.
Here’s a selection of tools that can monitor your system hardware and give you information you might find helpful such as your CPU temperature, or cooler fan speeds, or even the output values of the power supply. Do note that this list is for hardware monitoring tools only, if you want a combined hardware information and monitoring program such as Speccy or HWInfo, then look at our other article which includes these tools.
1. AIDA64
AIDA64 is a popular hardware monitoring device for computer owners to monitor their PC voltage and temperature. The tool offers support to over 250 types of sensor devices that track temperature levels, voltage, power draw, and fan speed. AIDA64 has a dashboard that displays all voltage metrics in real time, allowing the user to monitor the health status of their device easily.
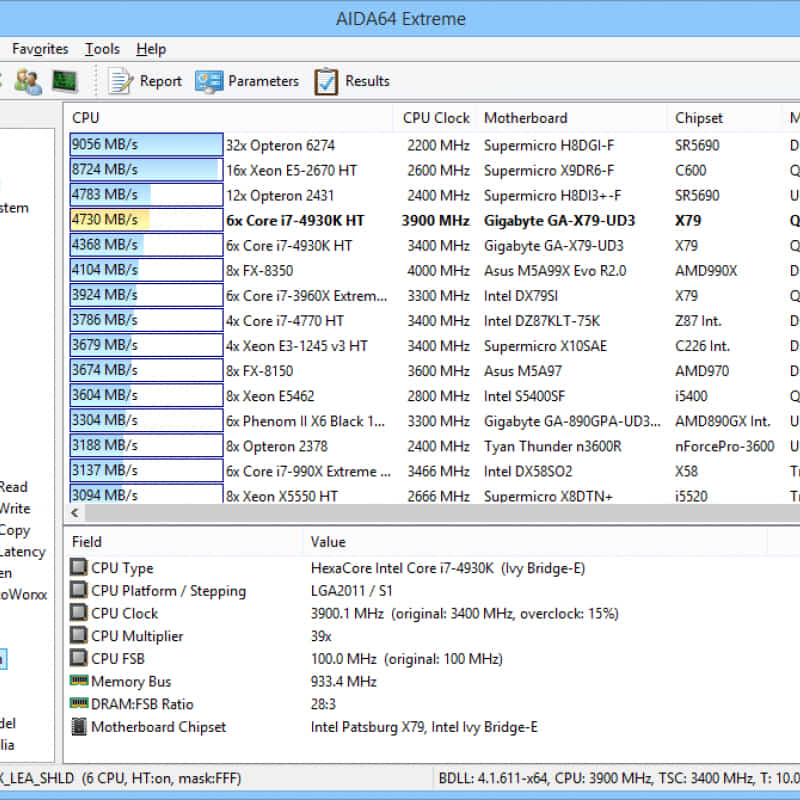
Furthermore, the software can display all sensor values differently: via an OSD panel, the system tray icons, a detailed graphical board, or a sidebar gadget. Users can also log the measurement values into a CSV file, HTML file, or export the results to an external application.
Furthermore, the software sends out alerts when sensor values exceed user-defined ranges. Users can also customize the system’s response when the sensor exceeds optimum values. For example, you can decide to shut down the computer, run a specific program, send out a notification, or play a unique sound. Regardless of your preference, the AIDA64 tool helps you stay on top of your game.
The Systemic Mechanic is an Iolo feature specifically designed to measure PC voltage values and health. The systemic DriveSense displays the device’s temperature and provides real-time reports on over 40 driver reliability and health indicators. Moreover, the program’s LiveBoost feature is a responsive technology that delivers a more effective analysis of what the computer needs to be in optimum health.
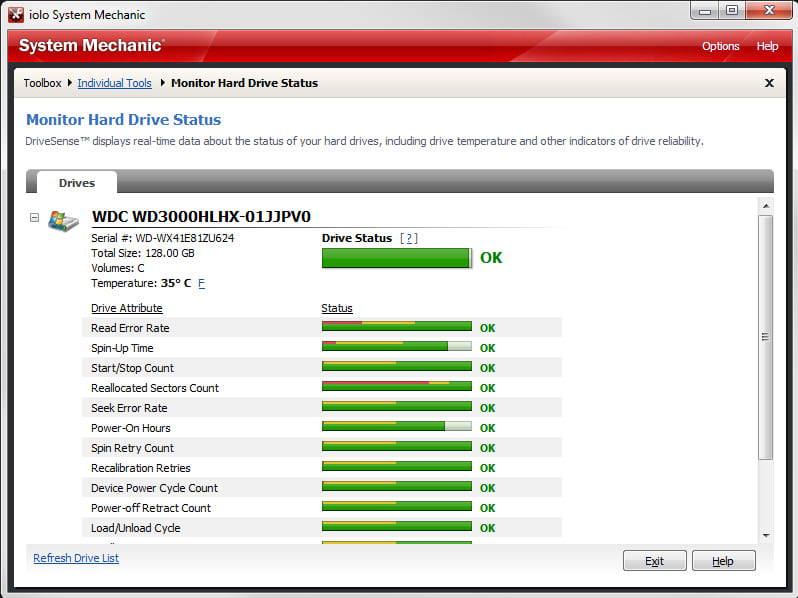
Furthermore, the Enhanced OptiCore hinders tasking CPU programs faster, allowing the system to deliver improved responses. The software is available to all versions of Windows and it uses a three-step approach to free clogged computer memory, helping the system run smoothly at optimal temperatures.
3. HWMonitor
Made by CPUID who are also responsible for CPU-Z and PC Wizard, HWMonitor is a great tool for displaying the majority of your systems temperatures, fan speeds and voltages. There are no real options as such, apart from a function to save monitoring or SMBus data to a text file. 3 sets of values are displayed; the current values and the minimum / maximum values since the program was started.
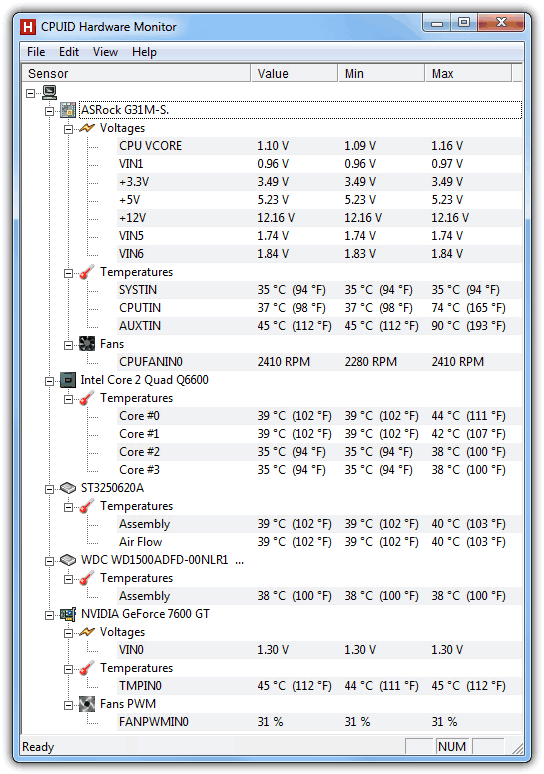
What most people like about HWMonitor is the clear and easy to read layout of all the values in one window for you to quickly scan for what readings you’re looking for. It doesn’t do anything else like controlling fan speeds or setting warning alarms, but for a simple display of all the relevant values, HWMonitor is hard to beat. There is a setup installer or separate 32-bit / 64-bit portable versions available.
4. Speedfan
Speedfan has been around a long time and is widely considered to be one of the best tools around to monitor just about every temperature, fan speed and voltage your system can provide and also control the speed of the fans if they run too slow or too fast and therefore noisy. Warnings can be set for the temperatures, there is S.M.A.R.T. information for the hard drives, and just about any value the program displays can be logged to a file. You can even set a trigger event of running a program or sending an email etc if a temperature reaches a certain value.
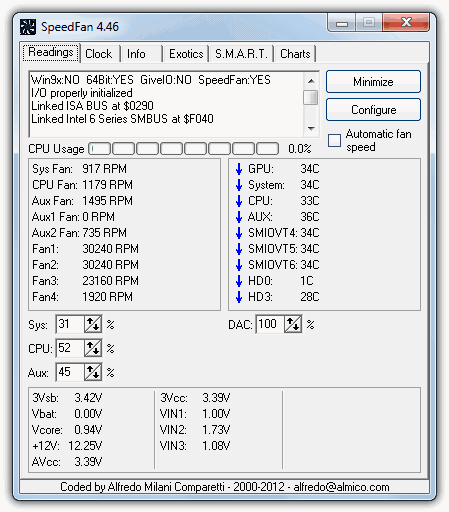
A graph is also available for any of the Temperature, fan speed or voltage readings you want to include. Speedfan does require a bit of setting up to get things configured to your liking, but there aren’t many other tools around with such control of fan speeds, alarms, logging etc. Sadly there is no portable version, but the installer contains no adware of any kind, so is well worth installing.
5. Open Hardware Monitor
We said previously that HWMonitor was hard to beat at displaying all the needed values in an easy to read window, well Open Hardware Monitor is probably the one tool that beats it and has been our clear favorite monitoring tool for a few years. In addition to temperatures, fan speeds and voltages, this tool can also display detailed CPU / GPU frequencies and load, memory information, hard drive storage space and remaining life and data throughput of SSD’s.
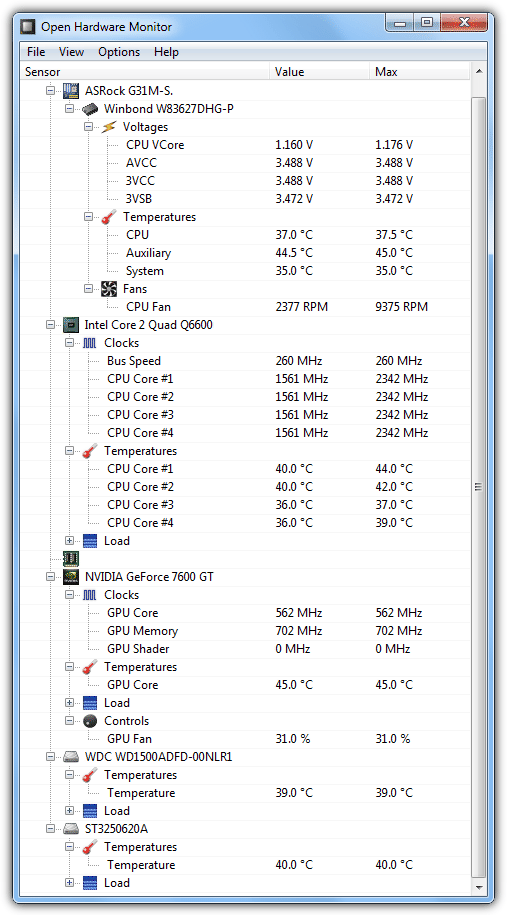
Add to that an optional plot graph for all available temperature sensors, and a desktop gadget that can display any value from the main window by right clicking on it and selecting “Show in gadget”, and you can see why Open Hardware Monitor is such a great program. Each value can also be renamed or hidden and some readings have a Parameter option to to adjust things like the offset etc. Open Hardware Monitor is a portable program and to get all the available readings make sure to run the program as Administrator.
Download Open Hardware Monitor
6. Core Temp
As the name suggest, Core Temp focuses mainly on providing accurate information for the core temperature values which are those from inside the CPU itself as opposed to the metal casing. There is also offset correction options and a Overheat Protection option which can set up notifications or sleep / hibernate / shutdown the machine when a certain temperature is reached. Owners of the Logitech G15 keybaord have an option to enable Core Temp readings on their LCD display.
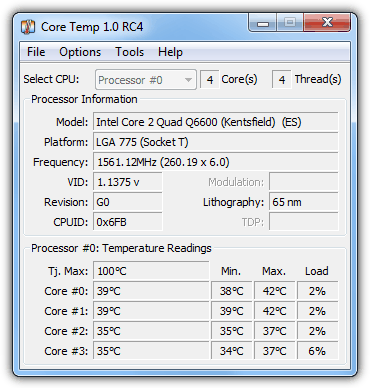
The program doesn’t support older processors like Pentium 4 or Athlon XP, but does have an interesting plugin feature where you can add in things like a sidebar gadget, graphs and also the option to get real time temperatures sent direct to your Android smartphone. Be careful if using the installer version as it contains InstallQ adware, or simply use the 32-bit / 64-bit portable version by clicking on “More Downloads”.
7. Real Temp
Real Temp is similar to Core Temp in that it concentrates mainly on the core temperatures inside your Intel processor, not AMD. This is a different reading from the other single CPU temperature value found inside your BIOS. The “Distance to TJ Max” value could throttle or shut down the machine if it reaches zero, but the TJ Max value itself is actually unknown for most desktop processors, and therefore the options to edit this value are best left to experienced users.
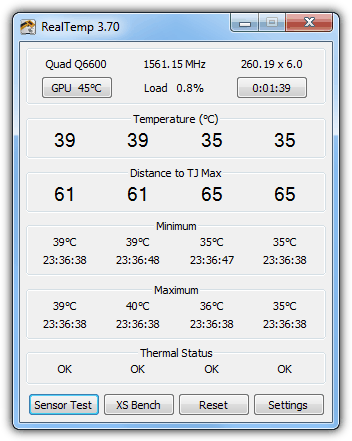
A small benchmark can be performed using the XS Bench button and there are alarms that can be set for CPU and GPU temperatures. A reading for AMD or Nvidia cards can be turned on from the settings window as can temperatures in the system tray area. Real Temp is a portable only program.
8. Hardware Sensors Monitor
This program isn’t free and the full version is a rather pricey $34 if you want the extras of HDD S.M.A.R.T. and GPU monitoring or CPU throttling. The demo also only runs for 10 minutes at a time and has a 14 day limit, but Hardware Sensors Monitor can still be useful to quickly check the motherboard, hard drive, graphics card and CPU temperatures as well as fans speeds and voltages, complete with a couple of small graphs if you click on the arrow next to the section title.
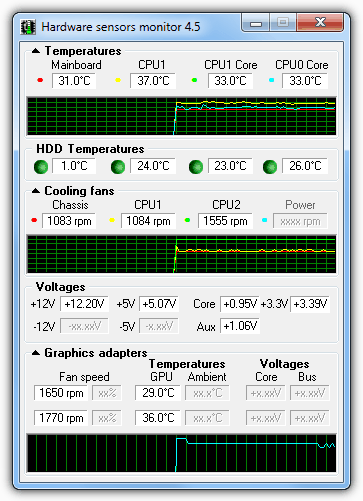
There are options in the settings window to make corrections to the temperatures, and several alarms can also be configured, but probably isn’t worth troubling yourself with in the free versions 10 minute time limit. Only an installer version is available.
Download Hardware Sensors Monitor
9. OCCT
OCCT is not actually primarily a hardware monitoring program, but a system stress tester which is useful to run and see what temperatures your system reaches under maximum load. There is however, no need need to use that part of the program if you don’t want because one of the 2 main windows is a standard hardware monitor complete with graphs to display sensor information such as power / CPU voltages, both sets of CPU temperatures, various frequencies and also memory and CPU usage.
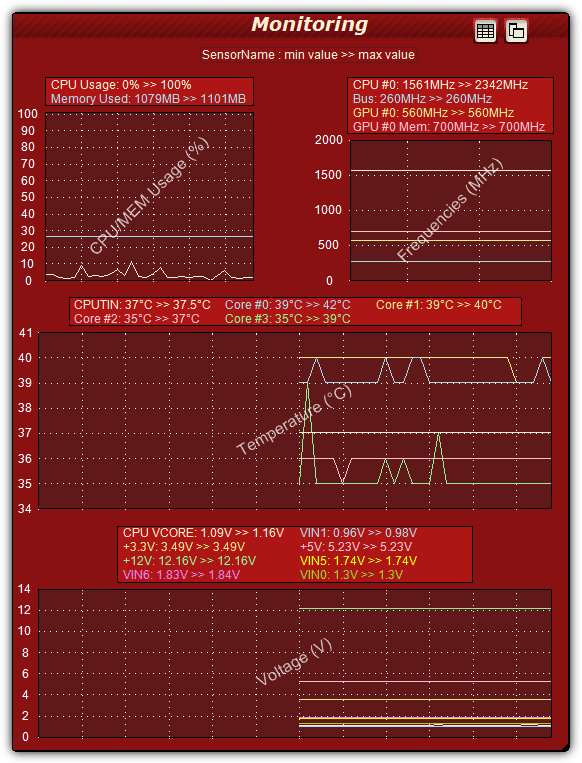
There are 3 different displays; graph, text or a mixture of both and extra values could be available in the settings which can be enabled or disabled. OCCT uses a built in version of HWMonitor to provide its values which can be changed to other 3rd party tools such as Aida64 or Core Temp. Portable or installer versions are available, but you can’t get rid of the awful color scheme!

Are there any power supplies with heat sensors? I’m curious how fast that power supply fan needs to run. At 5 volts its totally inaudible. But what if its stressed?
Some of the Corsair PSUs have monitoring for all sorts of things, I have an AX860i and can see fan speed, temperature, load, efficiency, etc.
CPUiD HWWizard used to be the best tool by far in my opinion then they dumped it for some reason and now their charging users to support the bs their puttin out here
HWinfo does indeed trump all these.
Also – MSI Afterburner good for graphs of GPU temps and stats for tuning
msi.com/page/afterburner
Good overview – Intel’s Exteme Tuning Utility very good too, with graphs etc – downloadcenter.intel.com/download/24075/Intel-Extreme-Tuning-Utility-Intel-XTU-
I want to install a program such as these, but I’m a bit confused about which of these might be “Gadgets” as opposed to programs or apps. I had “Gadgets” installed on my Windows 7 machine with all of this information and loved them, but was warned repeatedly not to install them again on my Windows 10 machine as they are unsafe.
I want an always on floating on the desktop solution.
As the screenshots show, these are all tools that have their own window on the desktop.
Something like Open Hardware Monitor has the option of a gadget which you can manually switch on.
HWinfo kicks their ass.
your blog kicks ass, raymond!
really!
~rob :)
Nice tool Raymond!