10 Ways to Easily Create Charts Online Without Using Excel or Any Software
Whenever you have a lot of text in a document or on a webpage, it can look quite boring to read, especially if there’s nothing in there to break it up a bit. Apart from images, one of the ways you can draw people’s attention to numbers or statistics is by the use of charts or graphs. Instead of providing only sets of numbers, a graphical display can be much easier to read and understand and takes far less time for the reader to process the raw data.
Of course, Office software such as Microsoft’s Excel provides a pretty easy way to create charts based on the data in the worksheet but if you want a chart for your website or document without having to resort to software you might not have installed, there are other ways to do it. As long as you have an internet connection, the easiest way to create a chart is by using one of the many online services to create one for you.
Here’s a selection of 10 websites that offer free online chart creation. Most of them offer multiple types of chart or graph and the results can be downloaded to your computer or linked directly from your website.1. ChartGizmo
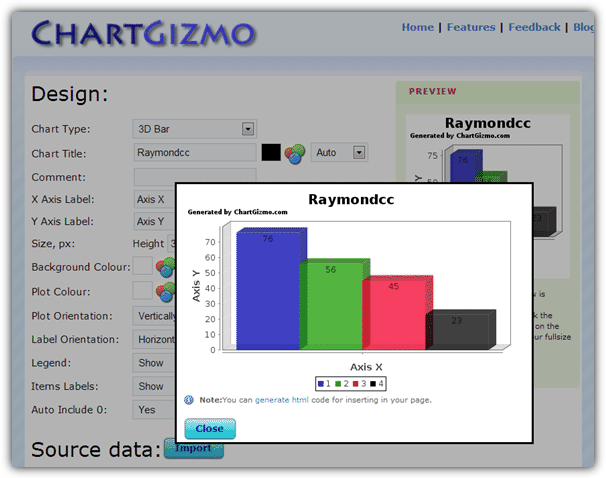
There are quite a few options available in ChartGizmo although you do have to create a free account to use the service. 10 different charts are available including 2D and 3D bar, line and pie, and also others such as ring or candle. Most aspects of creating the chart can be configured like colors, labels and orientation etc, and ChartGizmo supports several data sources that include static data, historical data and dynamic data from a HTML table. You can also use the Import button to paste in tab-delimited data or values from an Excel sheet. There are various ways to get the chart published on your webpage or you can simply save the image to your computer for use in documents.
2. ChartGo
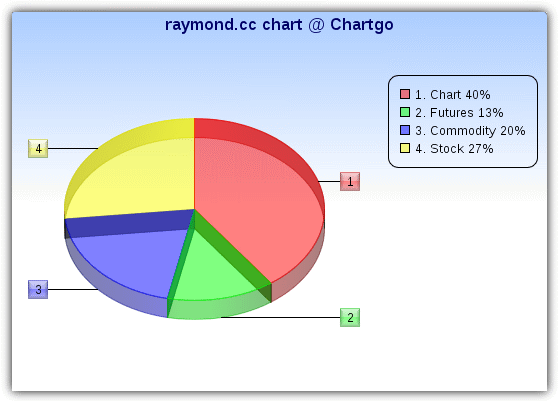
ChartGo can certainly create some nice looking and colorful charts with bar, line, pie and area types available. These can be either 3D or 2D and much of how the chart looks can be edited such as size, orientation, text, transparency and shadows etc. Apart from on the pie chart, you also have the option to use up to 5 data groups so each piece of data along the X axis can display 5 different values. When you enter the numeric data, each value goes on its own line and isn’t separated by comma’s. After clicking on the Create Graph button, there is still the option to switch between the graph types to see which looks best. Right click the image to save it to your computer and it can also be easily shared, saved or embedded in a blog page using the links provided.
3. Chartle.net
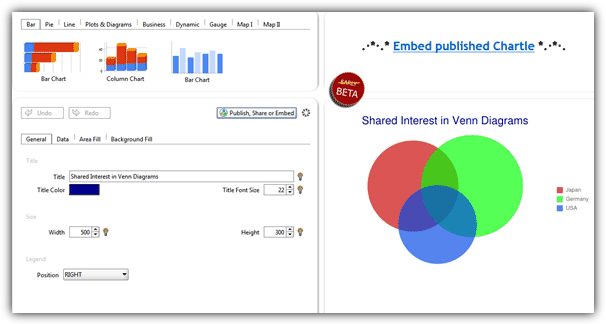
There’s a lot of different types of graphs, charts and plots you can create with Chartle.net for use on your website, many of them interactive. These come from Google Charts and include; bar, pie, org, line, radar and motion, scatter plots, tables, timelines, gauges, meters and even several types of world or location maps. As you might expect, some charts are more difficult to setup than others due to the extra information and configuration needed, but the data is well laid out in separate tabs and you shouldn’t find it too difficult getting anything to your liking with a little effort. Once published, you will be given the code to embed into your web pages, static charts can be saved to PNG or BMP by right clicking -> Save as. Sadly Excel data import/export is currently disabled.
4. DIY Chart
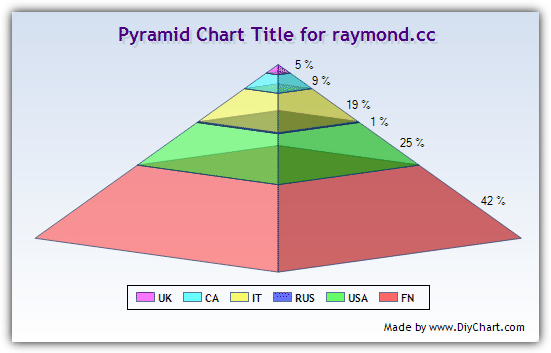
Registration is required at DIY Chart and the free account has a couple of limitations such as a maximum of 5 charts created at once and a small ad logo in the corner. Apart from that, there are nearly 30 different chart types to choose from including bar, area, pie, pyramid, bubble and range to name a few. Source data for the chart can be entered in manually or imported from a TXT or CSV file. Many of the charts parameters can be edited and you can also give it a description. Do note that the chart will be made public to other users unless you untick the “Public Chart” box in the description tab. A finished chart can be saved as BMP or PNG, HTML image link or a dynamic data chart link.
5. Chart Tool
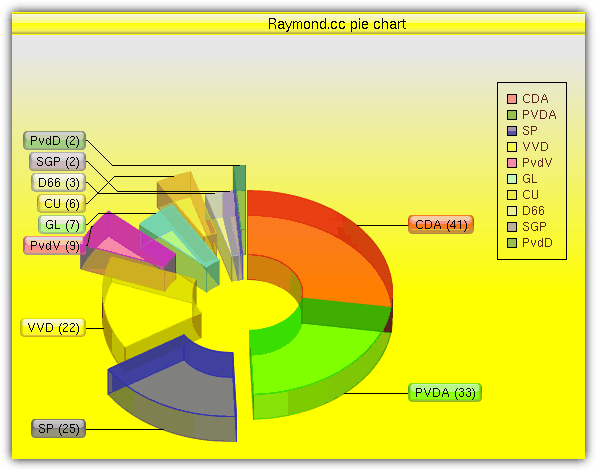
The charts created using Chart Tool do perhaps need a little more tweaking with the configuration options to get them looking great, but still produces an array of nice results. Several chart types are available such as bar, line, area, pie, xy, radar, scatter, bubble and meter, and they are able to be extensively edited along with their fonts, label and colors. All the values in the charts can have their own color with up to 50 sets of data in a single bar chart along with 4 groups in each. The output can be saved as either a PNG, JPG, CSV file and even a PDF document which might be useful. You can also send the graph to a friend using the box to email them. The option to create an account saves your charts for later editing.
6. BARCHART Generator
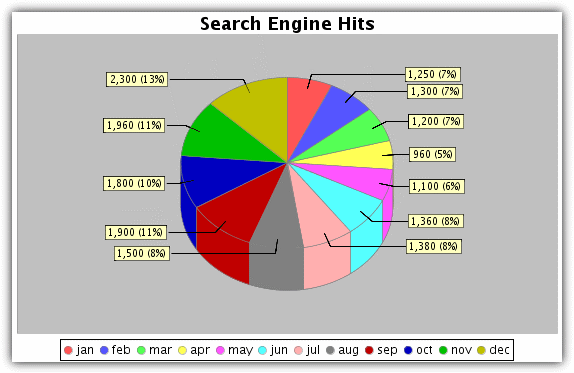
There are 3 different generator tools at the website; line chart, bar chart and pie chart. It doesn’t have the more fancy pastel colors, glass effects or vast array of controls to alter nearly every aspect of the chart and its text etc, but hopefully makes up for it by being easy to use. You are able to change the size of the chart, the labels and whether to have a simple 3D effect added, along with a selection of 13 basic colors. Enter your labels separated by semi colons “;” and then do the same with the values, note the tool doesn’t like duplicate labels. Multiple data sets can be added to the bar and line charts. Click on update and then right click on the image to save it to your computer.
7. Hohli Online Charts Builder
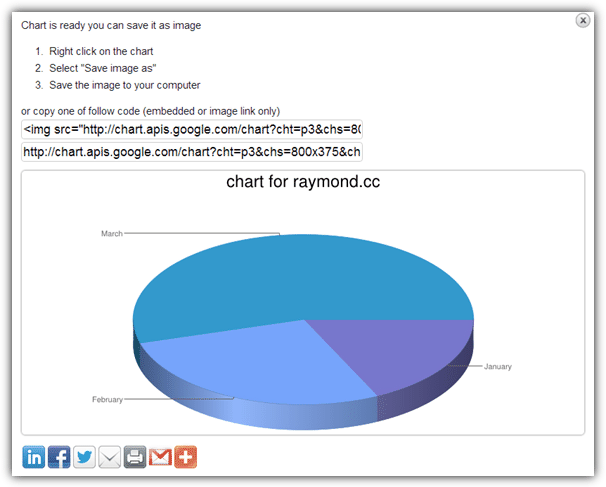
The Hohli Online Charts Builder uses the Google Charts API to help create the diagrams and charts you want. In addition to the line, bar, pie and radar charts, it can also produce Venn diagrams and scatter plots. If you have created a chart from the Google API before it can be loaded in from the URL. The sizes of the charts are fixed to a number of presets and data like titles and backgrounds can be configured, other settings appear depending on the type of chart you are creating. Give each piece of data a label and a value, then save it or edit / delete a previous value using the icons. The final chart can be displayed by clicking the preview window on the right from which you can right click and save the image or use the provided code for your webpage.
Visit Hohli Online Charts Builder
8. Google Chart Editor
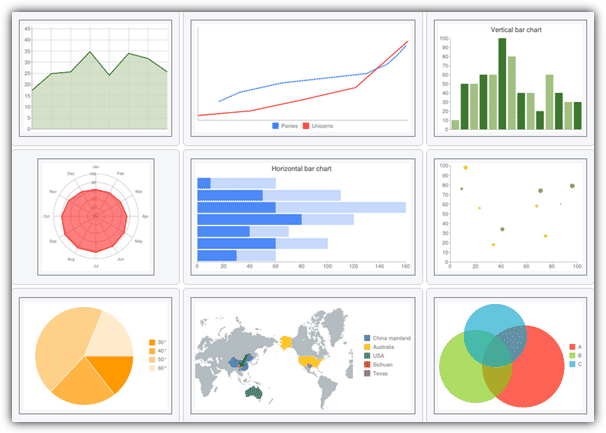
This editor is similar to the Hohli tool above in that it uses the Google Chart API to create its designs, but this tool is a lot more advanced with many more options to edit the text, colors and general look of what you’re trying to create. There are 11 chart types including; line, bar, pie, radar, scatter plot, Venn diagram and Google-o-meter. The more specialized types are thematic maps, map charts and even quick response QR codes can be created for mobile device users. If you’re not sure how to start with your chart, any one of the around 40 examples in the gallery can be used as a base template. The finished product can be saved by right click or the code can be used in your webpage.
9. Math Warehouse Chart and Graph Makers
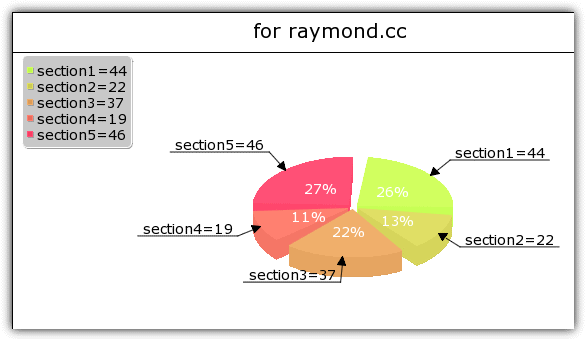
The charts at Math Warehouse are pretty basic and the selection of types is small compared to some others, but might be enough if you want a simple bar, pie or scatter chart. The process guides you through a series of steps to configure how everything will look and what data needs to be included into it. Eventually the button will show to render the chart and then you can simply click on it to save the image to your computer. One major drawback is you cannot go back and edit the chart if something needs tweaking, the whole process will start over which can get frustrating especially if you mistype a single value or label.
Visit Math Warehouse Chart and Graph Makers
10. MathCracker Pie Chart Tool
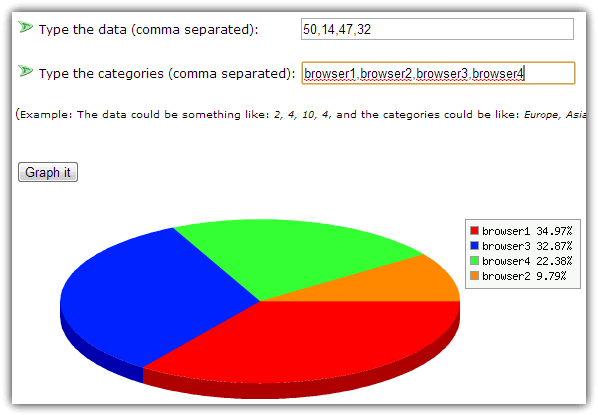
This pie chart maker is very basic tool only creating a simple 3D pie chart, but that also makes it about as easy to use as you can get to put in your own documents or webpages etc. Enter your data into the top box separated by commas, and then give each piece of data a name in the second box, again comma separated. Press the “Graph it” button and the tool will take the values and convert them into a percentage placing them into the 3D chart. Then right click on the chart and save the PNG image to your computer.
Visit MathCracker Pie Chart Tool
There are many of these chart creation website around, and another couple which didn’t fit into the list are Google Chart Generator which is similar to tools #7 and #8 above, and also Rich Chart Live can create interactive flash based charts, albeit with an animated watermark advertisement.

New free online tool for creating pivot tables / charts in a few clicks: seektable.com
Another addition to the list: charte.ca
Free online interactive chart builder.
try Livegap Charts builder charts.livegap.com
if you want to build a chart (Bar-line-radar-polar area,pie,…)
Easily Create Your Chart Online and save as image.(Free ,No registeration Or download)
Nice summary HAL9000.
We’d love your feedback on the approach we’re taking with datacopia.com … where we’ve reversed the charting process, so you no longer need to know up front how you want to represent your data – you just plug it in and let the system suggest the best fit visualizations.
many thanks
Thanks, Hal9000. Just what I needed. Again, Raymond.cc to the rescue! Keep-up the great work…
Excellent web site. A lot of useful info here.
I am sending it to a few friends and also sharing in delicious.
And obviously, thanks on your sweat!
Thank you for create charts online tutorial.
thanks raymond it is a great list especially for the presentation ,also i hope the formatting option problem will not be there thanks wonderful
nice information……..
thanks for the information.
Thanks for sharing …. Good Informations
Thanks for the tip
Thank you Raymond.
This is really a good post
Thank you very much Raymond, this can be really handy without Excel .
thanks a lot……
Thank You for sharing the information..!!